The Water Bill Nobody Noticed: How Budget Variances Catch Problems Before They Become Expensive
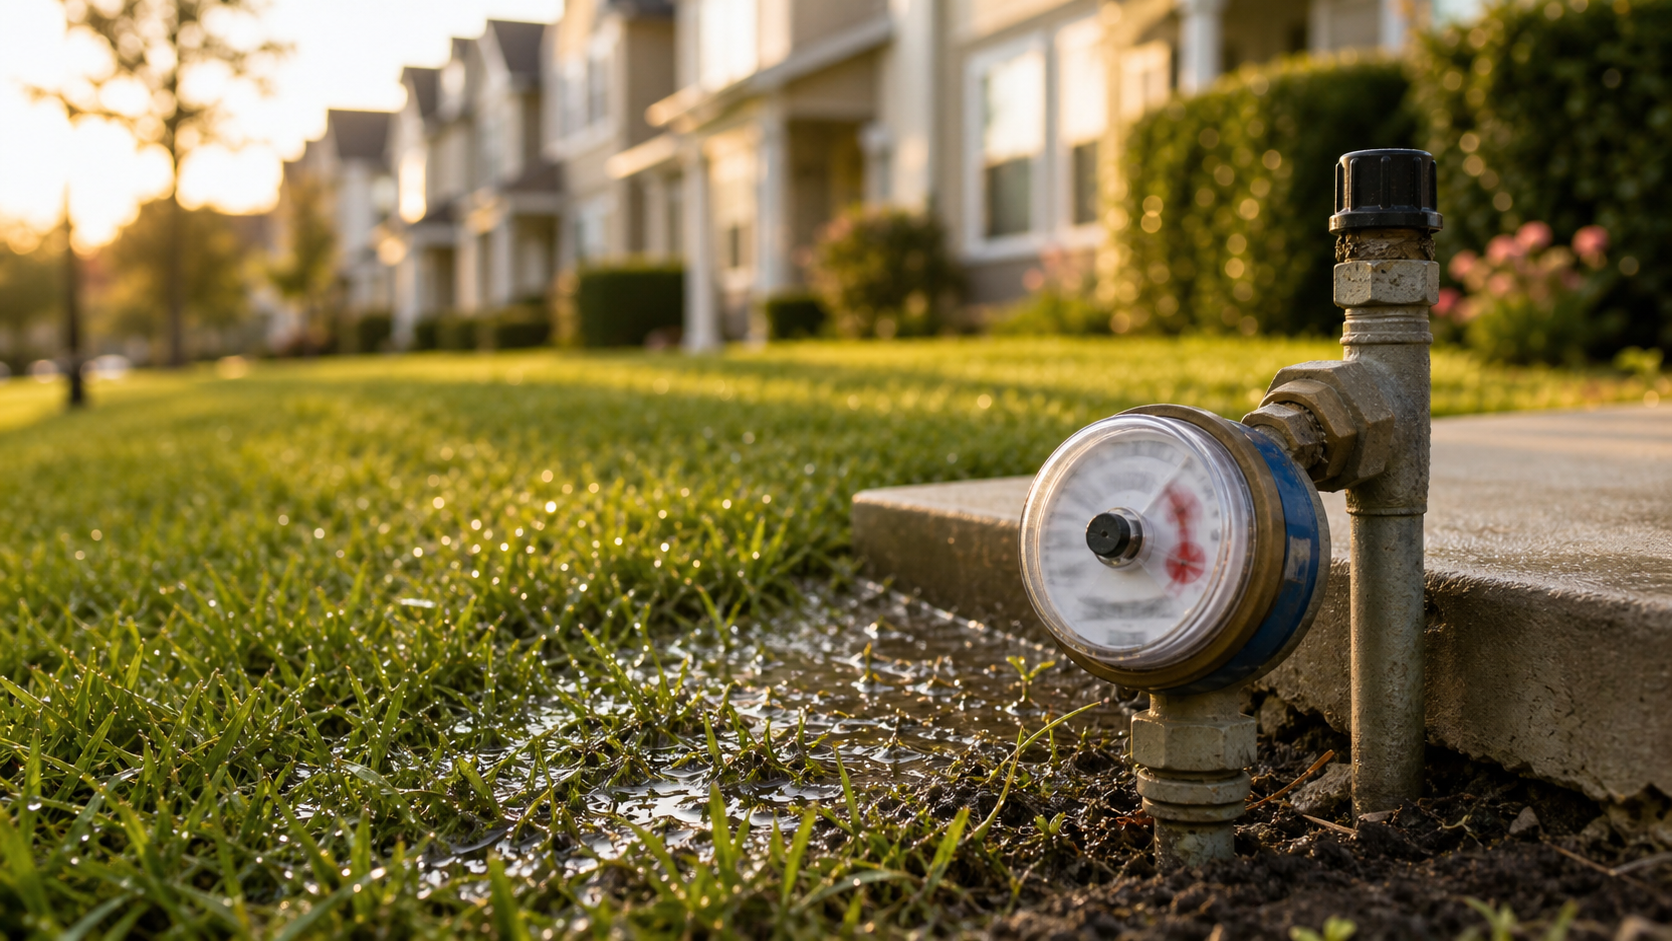
A tree trimming crew comes through the property, does their work, packs up, and leaves without anyone noticing that one of their trucks clipped an underground water pipe on the way out. The pipe does not burst dramatically. It just leaks, slowly and steadily, underground where nobody can see it.
The water keeps running, the meter keeps turning, and the bill keeps climbing. By the time anyone notices, the community’s water line item is not at $3,000 where it was budgeted. It is at $7,000 and still going, which means $4,000 the board did not plan for is coming out of a fixed operating budget with nowhere obvious to absorb it.
This kind of thing happens more often than most boards realize, and water is one of the line items where it shows up most frequently. The question is not whether unexpected expenses will occur because they will. The question is how quickly the board finds out.
What the Variance Column Is Actually For
Most boards receive some version of an income and expense report every month, but what many of them do not receive, or do not use, is a comparative version of that report. A comparative income and expense report shows three things side by side for each line item, for both the current month and year to date:
- The actual amount spent
- The budgeted amount for that period
- The variance between the two
Here is a simplified example of what that looks like in practice:
| Line Item | Budgeted (Month) | Actual (Month) | Variance |
| Water | $250 | $580 | ($330) |
| Landscaping | $1,200 | $1,200 | $0 |
| Insurance | $800 | $800 | $0 |
| Maintenance | $500 | $510 | ($10) |
The water line jumps out immediately. Everything else is tracking on budget, but water is running more than double what was projected, and that variance is the signal to start asking questions. Without that comparison built into the report, a $7,000 water bill can sit in the financials for months before anyone connects it to a problem that could have been stopped much earlier.
The Difference Between Seeing Numbers and Reading Them
This is the distinction that matters most for boards reviewing their financials each month. Looking at a list of expenses tells you what was spent, but comparing those expenses against the budget tells you whether something is wrong.
A line item running 20% over budget in March might be a timing issue, but the same line item running 130% over budget by June is something else entirely and needs to be investigated before it compounds further. The sooner the board sees the variance, the more options they have. They can slow down spending in other areas, investigate the cause, or take operational action to stop the problem before the year-end shortfall forces a harder conversation with homeowners.
What Good Reporting Makes Possible
A comparative income and expense report, reviewed consistently every month by the full board and not just the treasurer, is what gives communities the visibility to act while they still have options. The sooner the board sees the variance, the more options they have before the year-end shortfall forces a harder conversation with homeowners.
At Community Financials, this report is included in every client’s monthly financial packet as a standard. It is the same report I relied on for 25 years as a community association manager to keep communities on budget, and in my experience it is the single most useful tool a board has for catching a problem early enough to do something about it.
If your board is not currently receiving a report that shows actual spending against the budget with a variance column, that is worth addressing before the next surprise shows up in the numbers.
Schedule a call at CommunityFinancials.com or call 833-CONDO-HOA.
Important Disclaimer: This post is for educational purposes only and does not constitute legal, tax, or financial advice. Always consult a qualified attorney and CPA for guidance specific to your community.