See How Your HOA or Condo Dues Compare to the Average in Your State
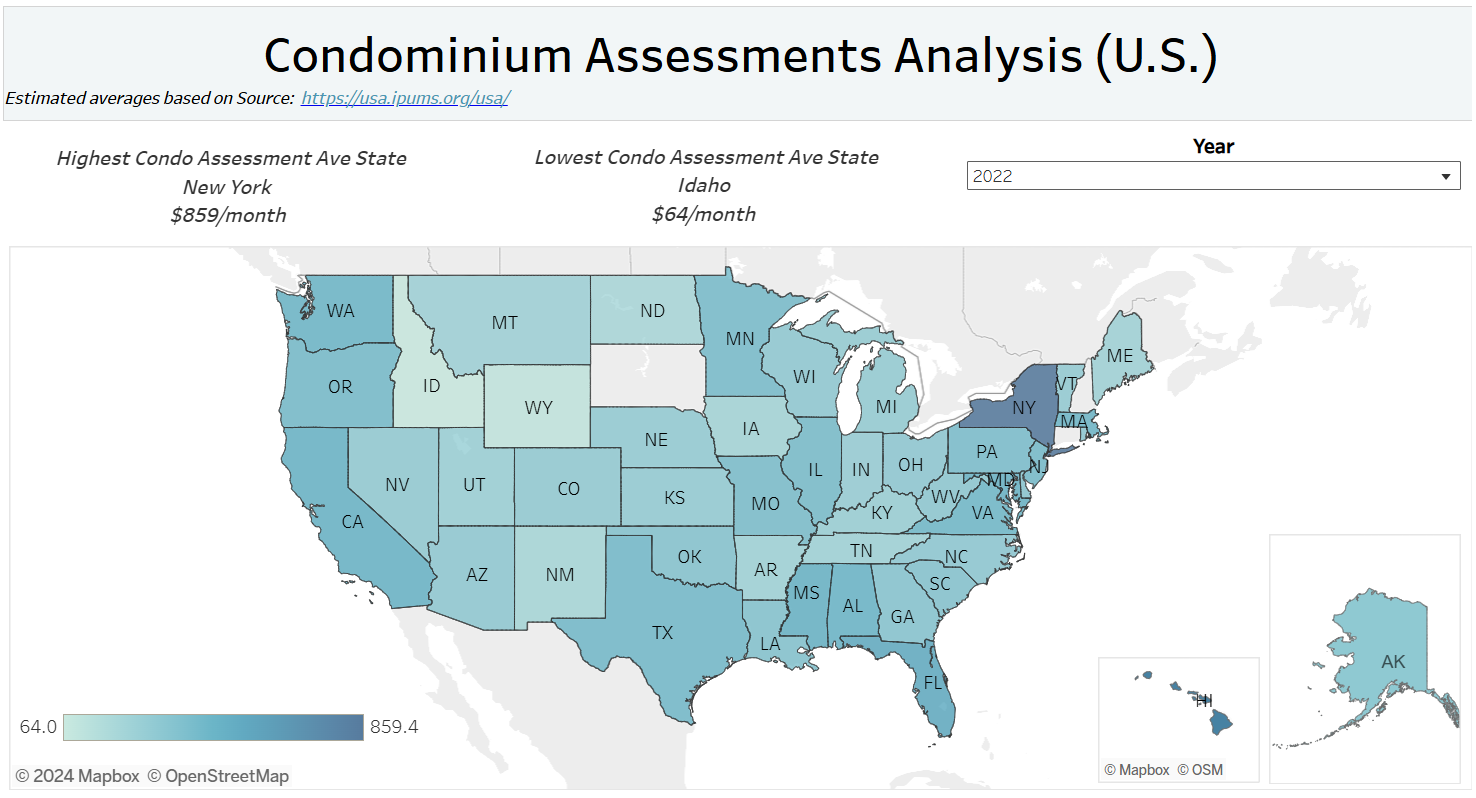
Community association boards and property managers understand how crucial it is to set fair and sustainable condominium assessments. However, knowing whether your assessments align with the market or need adjustment can be challenging. Thankfully, the Foundation for Community Association Research has developed an invaluable tool to assist you in comparing your condo dues to those across the nation. Enter the New Condominium Assessment Dashboard, a powerful tool that allows you to explore and compare assessment trends by state from 2018 through 2022.
A Game-Changing Resource for Boards and Managers
The Condominium Assessment Dashboard is an innovative resource that leverages Tableau technology to present an interactive, data-driven experience. Whether you’re a board member, community manager, or an industry professional, this dashboard provides essential insights into how average condominium assessments have changed across various states. The ability to quickly access this data is indispensable when making informed decisions about raising or adjusting dues.
How It Works
The dashboard pulls data from the IPUMS USA database, a comprehensive collection of U.S. census and survey data. This highly regarded resource has long been used for demographic, social, and economic research, ensuring that the information presented is reliable and up-to-date. By integrating IPUMS USA data into an easy-to-navigate dashboard, the Foundation has created a tool that’s not only powerful but user-friendly as well.
Users can filter data by state and view trends from 2018 to 2022. This allows community managers to compare their condo assessments with those of similar regions, providing a clear picture of where they stand. The interactive nature of the dashboard means that users can drill down into specific years, states, and even national averages to understand the trends in the condominium assessment landscape.
Why It Matters
Setting appropriate condo dues is a balancing act—too high and you risk losing owners, too low and you might struggle to maintain the community’s financial health. Having access to clear, state-by-state comparisons can give you the confidence to make decisions that are in line with regional trends, helping ensure that your assessments are competitive, fair, and sustainable.
This tool is especially helpful as a talking point when engaging with owners about raising dues. If your community’s dues are below the average for your state, you can use this data to explain why an increase is necessary. By comparing your assessments to the state or national averages, you can make a strong case that your dues need to be adjusted to remain competitive and adequately fund the community’s needs.
Of Course, One Size Doesn’t Fit All
Of course, each community is unique. High rise properties have different needs from townhomes. Your community may be small or have few common elements to maintain and no amenities, or it may be waterfront with a club house, have pools, or other amenities like a fitness center, tennis courts, golf, or other sporting facilities. You get the idea. No one size fits all however, the data provides a useful benchmark to compare your community against.
Streamlining Condo Dues with the Assessment Dashboard
Whether you’re in the process of raising dues or simply trying to understand the landscape of condo assessments better, the Condominium Assessment Dashboard by The Foundation for Community Association Research is an indispensable tool. It provides boards and managers with critical data to ensure that their condo assessments remain fair, competitive, and in line with industry standards, helping maintain the community’s financial health.


